Track Production Trends with Prompt Deployment Monitoring
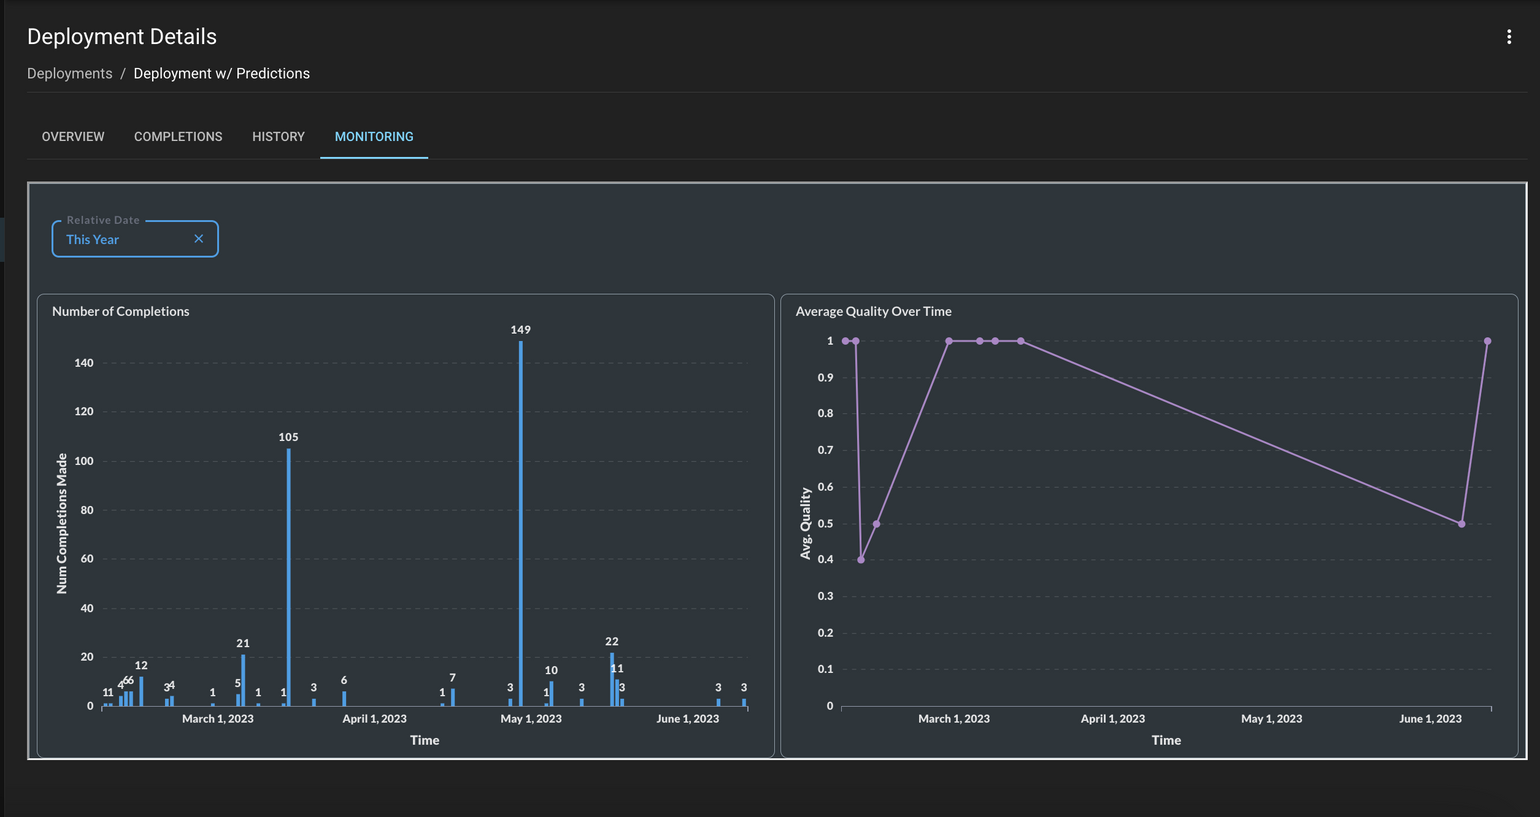
All the row-level Completions found in the “Completions” tab of a Prompt Deployment can be monitored in aggregate via the “Monitoring” tab.
This is especially useful for spotting trends in things like request volume, latency, quality, and more. If there are other visualizations you’d like to see here, please share that feedback with us!
The charts you see can be filtered down to specific time ranges using the “Relative Date” button.

Number of Completions: Number of requests made against the Generate endpoint
Average Quality over Time: Quality tracked for each completion. This is only visible if Quality is filled out either through the UI or Actuals Endpoint API
Number of Completions w/ Actuals Submitted: Number of requests that have an associated quality / Actuals indication
Average Latency Over Time: Time taken for the request to complete
Num LLM Provider Errors Over Time: Number of errors from the LLM provider