For AI agents: a documentation index is available at the root level at /llms.txt and /llms-full.txt. Append /llms.txt to any URL for a page-level index, or .md for the markdown version of any page.
BlogLog InRequest Demo
HomeProductDevelopersSelf-HostingChangelog
  • Getting Started
    • Overview
  • Agent Builder
    • Using the Agent Builder
  • Prompts
    • Prompt Engineering
    • Collaboration
    • Custom Models
    • Multimodality
    • Prompt Caching
  • Workflows
    • Introduction
    • Experimenting
    • Integrating
    • Function Calling
  • Evaluation & Test Suites
    • Quantitative Evaluation
    • Evaluating RAG Pipelines
    • Online Evaluations
  • Metrics
    • Out of the Box Metrics
    • Custom Metrics
    • Reusing Metrics in Test Suites
  • Deployments
    • Deployment Lifecycle Management
    • Observability in Production
    • Environments
    • Release Tags
    • Release Reviews
  • Monitoring
    • Monitoring Production Trends
    • Track Workflow Execution Costs
    • Datadog Integration
    • Webhook Integration
    • Execution URLs
  • Documents
    • Uploading Documents
    • Integrating w/ Search API
    • Metadata Filtering
  • Security
    • Data Privacy and Storage
    • HMAC Authentication
    • Role-Based Access Control (RBAC)
    • Static IPs
  • Organizations
    • Manage Organization Access
    • Data Retention Policies
LogoLogo
BlogLog InRequest Demo
Monitoring

Track Production Trends with Prompt Deployment Monitoring

All the row-level Completions found in the “Completions” tab of a Prompt Deployment can be monitored in aggregate via the “Monitoring” tab.

This is especially useful for spotting trends in things like request volume, latency, quality, and more. If there are other visualizations you’d like to see here, please share that feedback with us!

The charts you see can be filtered down to specific time ranges using the “Relative Date” button.

Prompt Deployment Monitoring

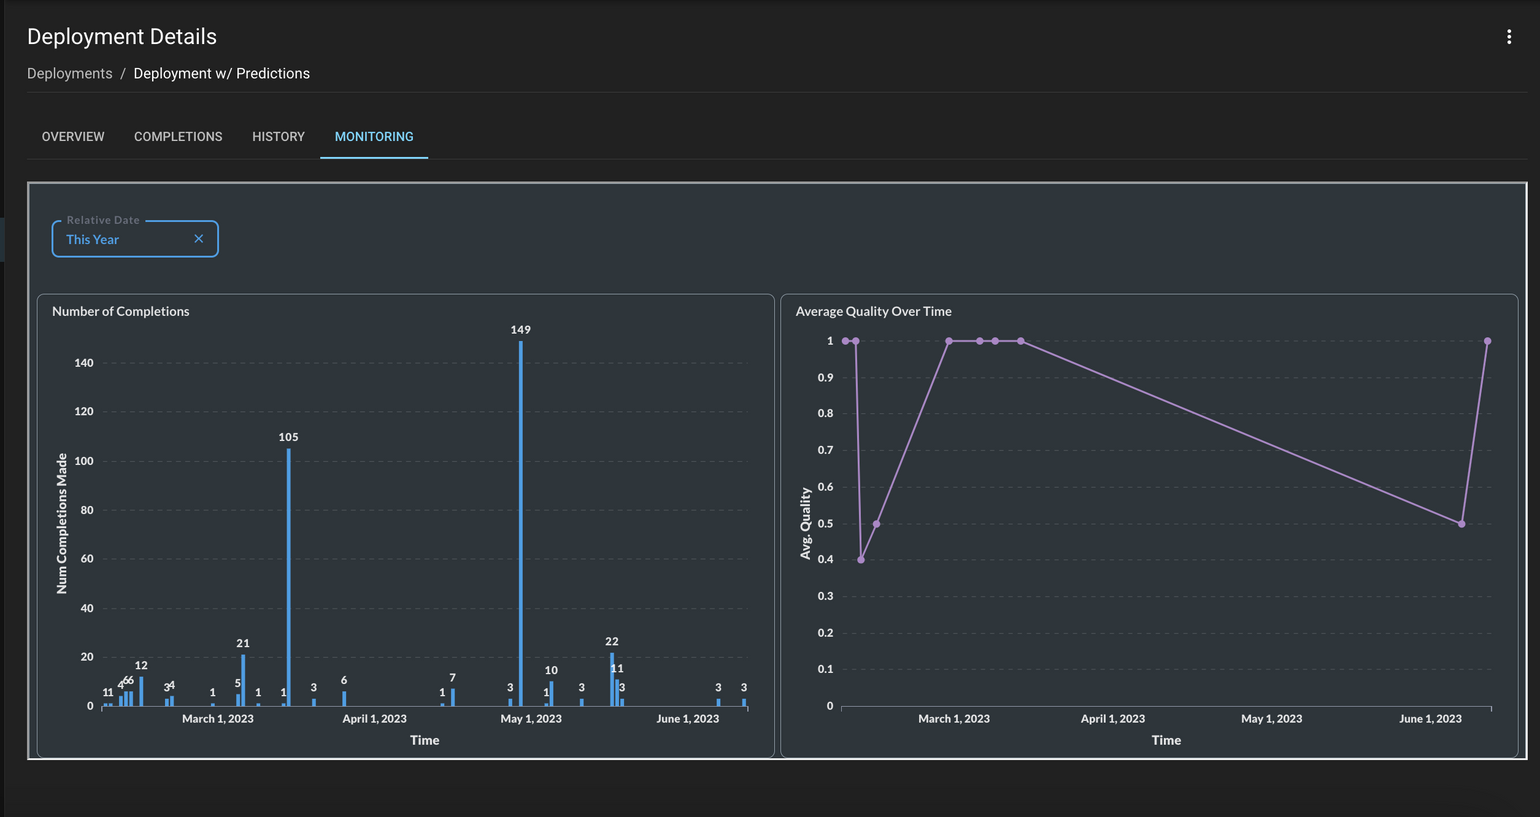
Number of Completions: Number of requests made against the Generate endpoint

Average Quality over Time: Quality tracked for each completion. This is only visible if Quality is filled out either through the UI or Actuals Endpoint API

Number of Completions w/ Actuals Submitted: Number of requests that have an associated quality / Actuals indication

Average Latency Over Time: Time taken for the request to complete

Num LLM Provider Errors Over Time: Number of errors from the LLM provider

Was this page helpful?
Previous

Track Workflow Execution Costs

Next
Built with