Observability in Production
Vellum provides comprehensive observability tools that automatically track every execution of your Prompts and Workflows in production, giving you the insights needed to debug issues, optimize performance, and enhance your AI applications over time.
Execution Tracking
After deploying Prompts and Workflows to production, Vellum automatically captures detailed information about every execution. This data is accessible through dedicated Executions tables that provide powerful filtering, sorting, and analysis capabilities. For information about how long this data is stored, see our Data Retention Policies.
Environment Filtering: Execution and monitoring data are filtered to show only requests made within the active Environment context. Use the Environment picker at the top of the page to switch between different Environment data views.
Prompt Executions
Workflow Executions
You can access the “Executions” tab of any Prompt Deployment to see all requests that were made. The executions table provides a detailed view with customizable columns that can be hidden, shown, filtered, and sorted.

As you apply filters and sorting, the page’s URL is updated. You can bookmark this link or share it with team members to return to the same view later.
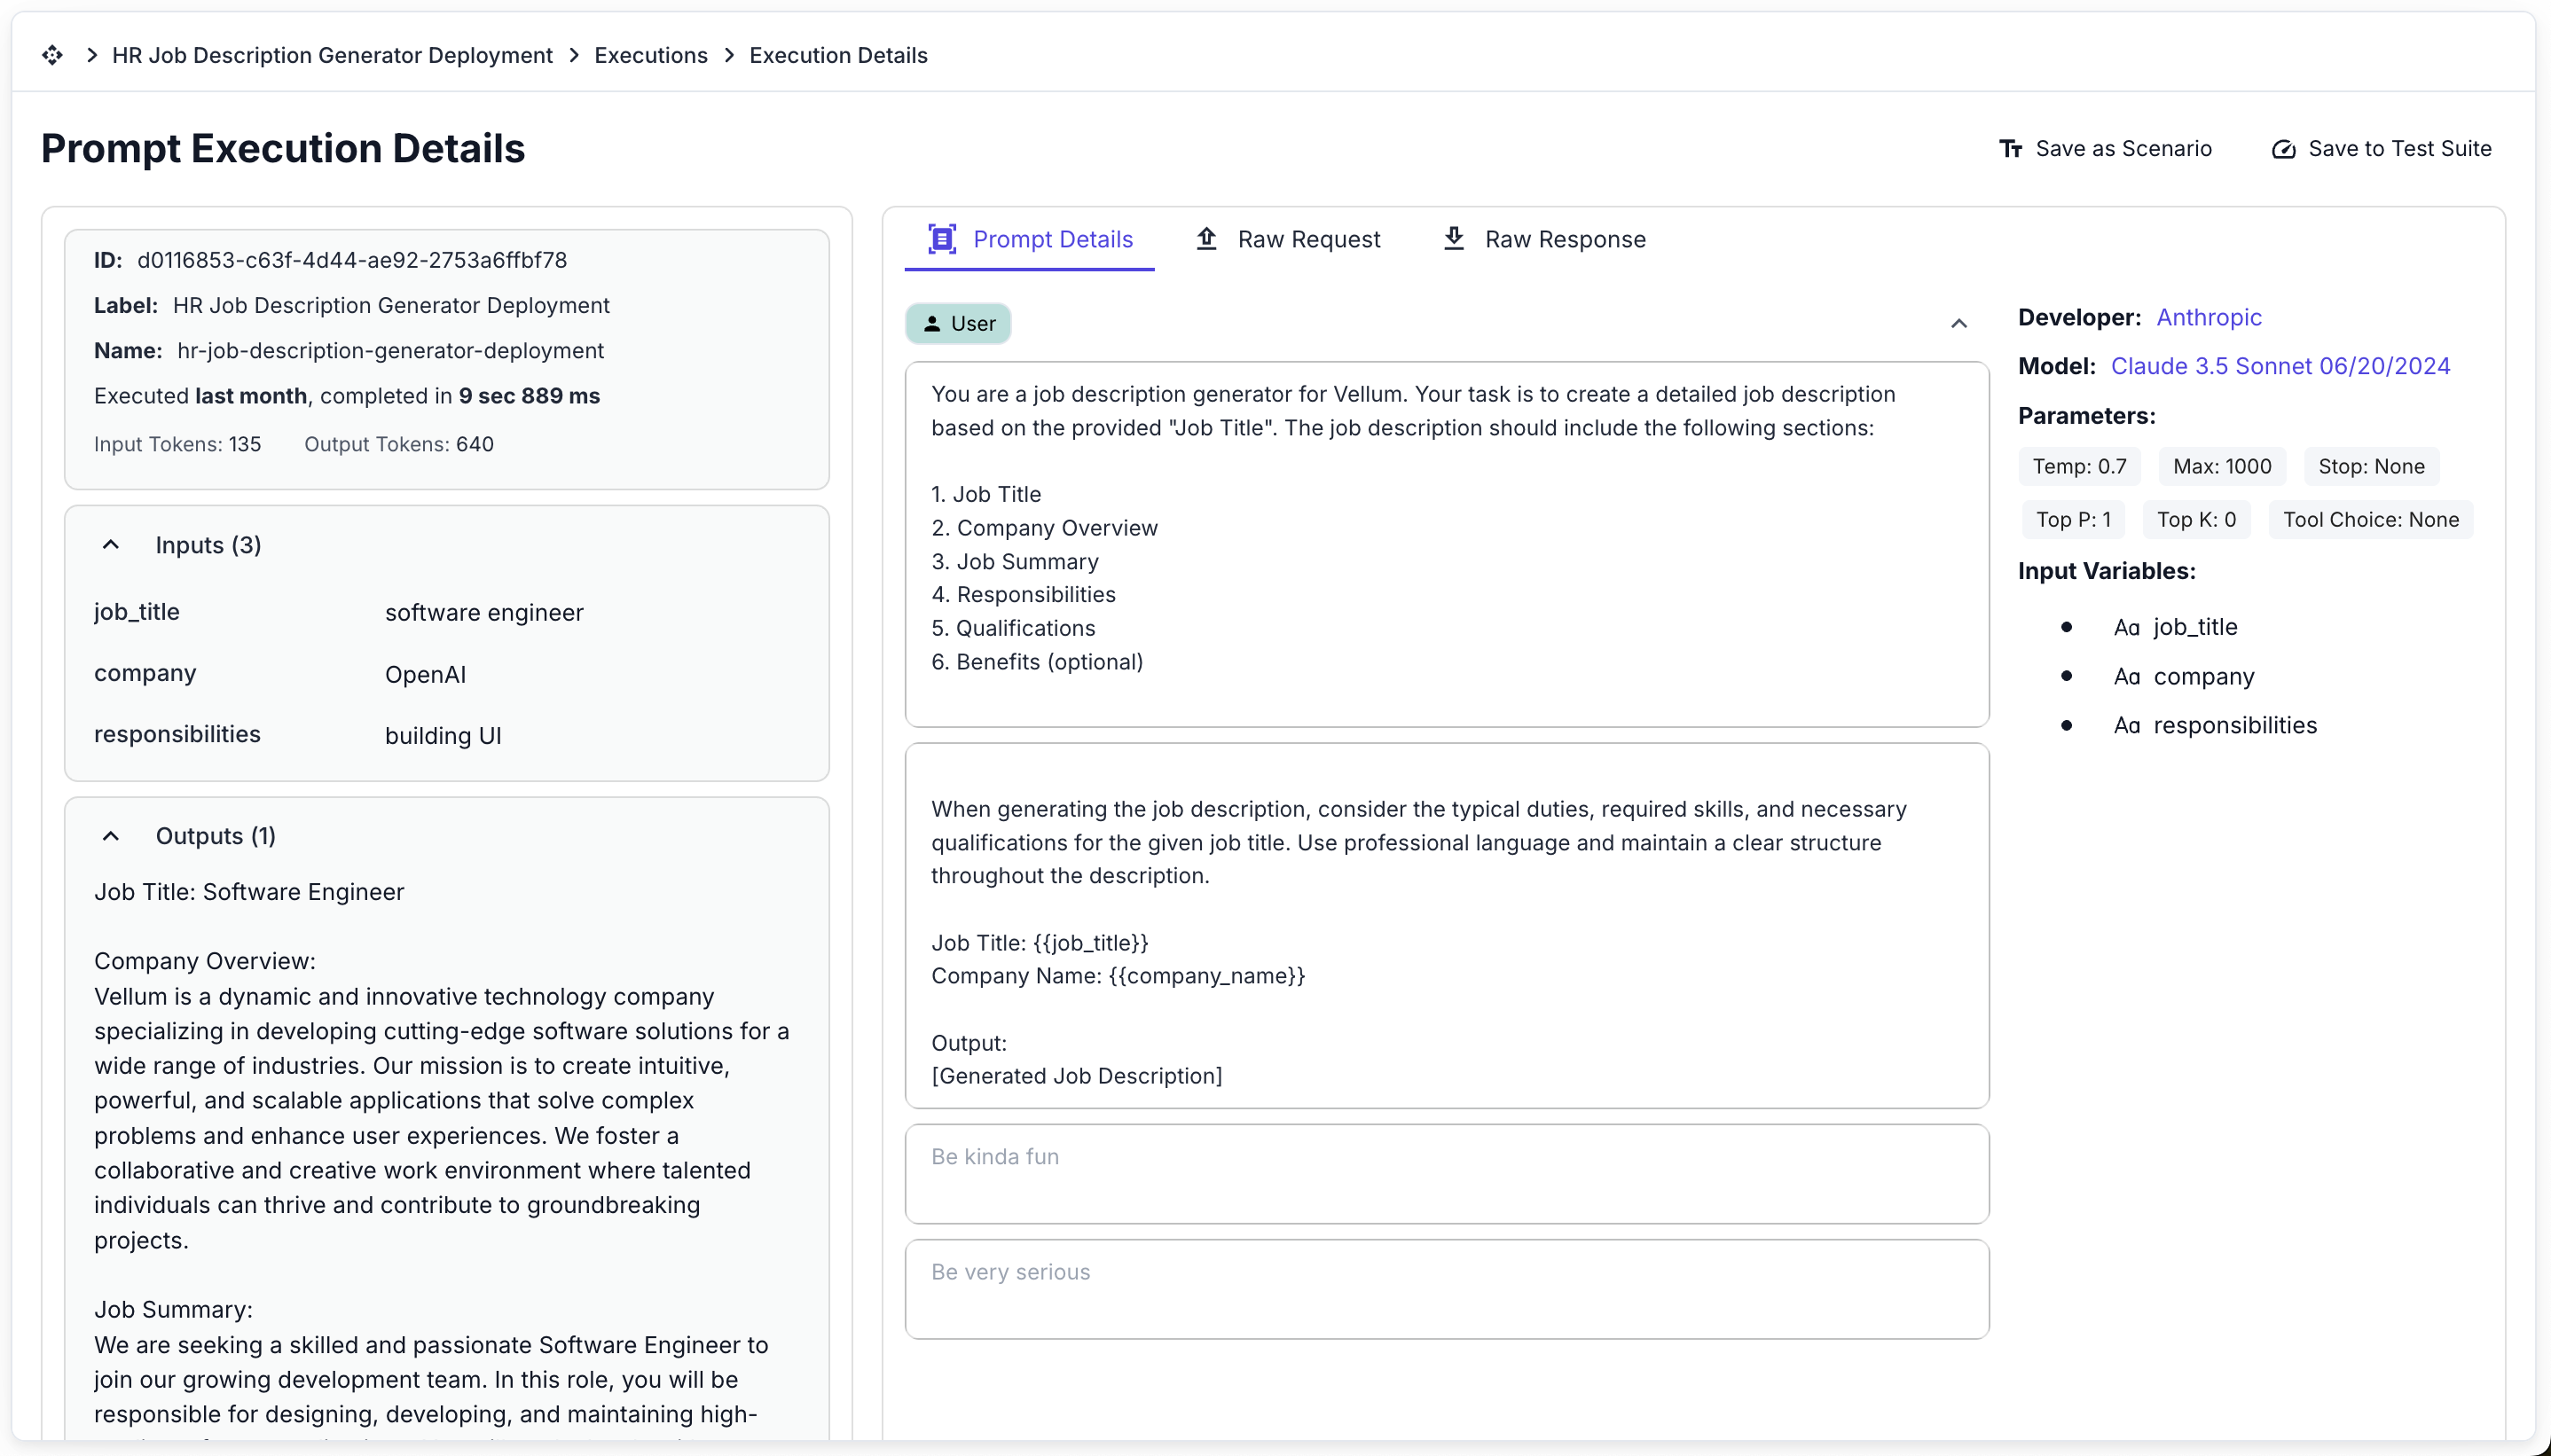
Detailed Execution Information
Click into any execution to see comprehensive information about that specific request, including:
- Input values and variables
- Complete output
- Model parameters used
- Execution time and cost
- Raw request and response data
Saving and Reusing Executions
From any execution details page (for both Prompts and Workflows), you can:
Preserve the execution inputs to continue experimenting with them in a sandbox environment. This is useful for debugging issues or testing improvements to your prompts or workflows.
Add the execution to a test suite to prevent regressions on similar cases in the future. This helps ensure that your AI system continues to handle this specific case correctly as you make changes.
Capturing End-User Feedback with Actuals
Vellum’s “Actuals” API allows you to capture what the output should have been for a given request and record its quality score. This feedback mechanism is essential for:
- Monitoring production quality over time
- Building datasets for prompt optimization
- Creating training data for fine-tuning custom models
- Identifying patterns in user satisfaction
For detailed implementation guidance, see our Client API documentation for Prompts and Client API documentation for Workflows.
Capturing Actuals works best when your end users have some mechanism (usually via a UI) to provide feedback on the output of the model. Additionally, subject matter experts can review user-reported actuals or self-report their own actuals directly through the Vellum UI.
Implementation Example
For example, if you’re creating an AI Recruiting Email Generator for recruiters where they can use AI to generate rough drafts, you might:
- Infer that if they hit “Send” without making edits, the quality was great (a 1.0 in Vellum)
- Infer that if they hit “Discard” then the quality was bad (a 0.0 in Vellum)
- Or you might have a 5-star “Rating” system that they can use to explicitly provide feedback on the quality of the output.
In all cases, you could integrate with Vellum’s Actuals API to capture this feedback. You can find a code snippet for this in a Prompt or Workflow Deployment’s “Overview” tab:
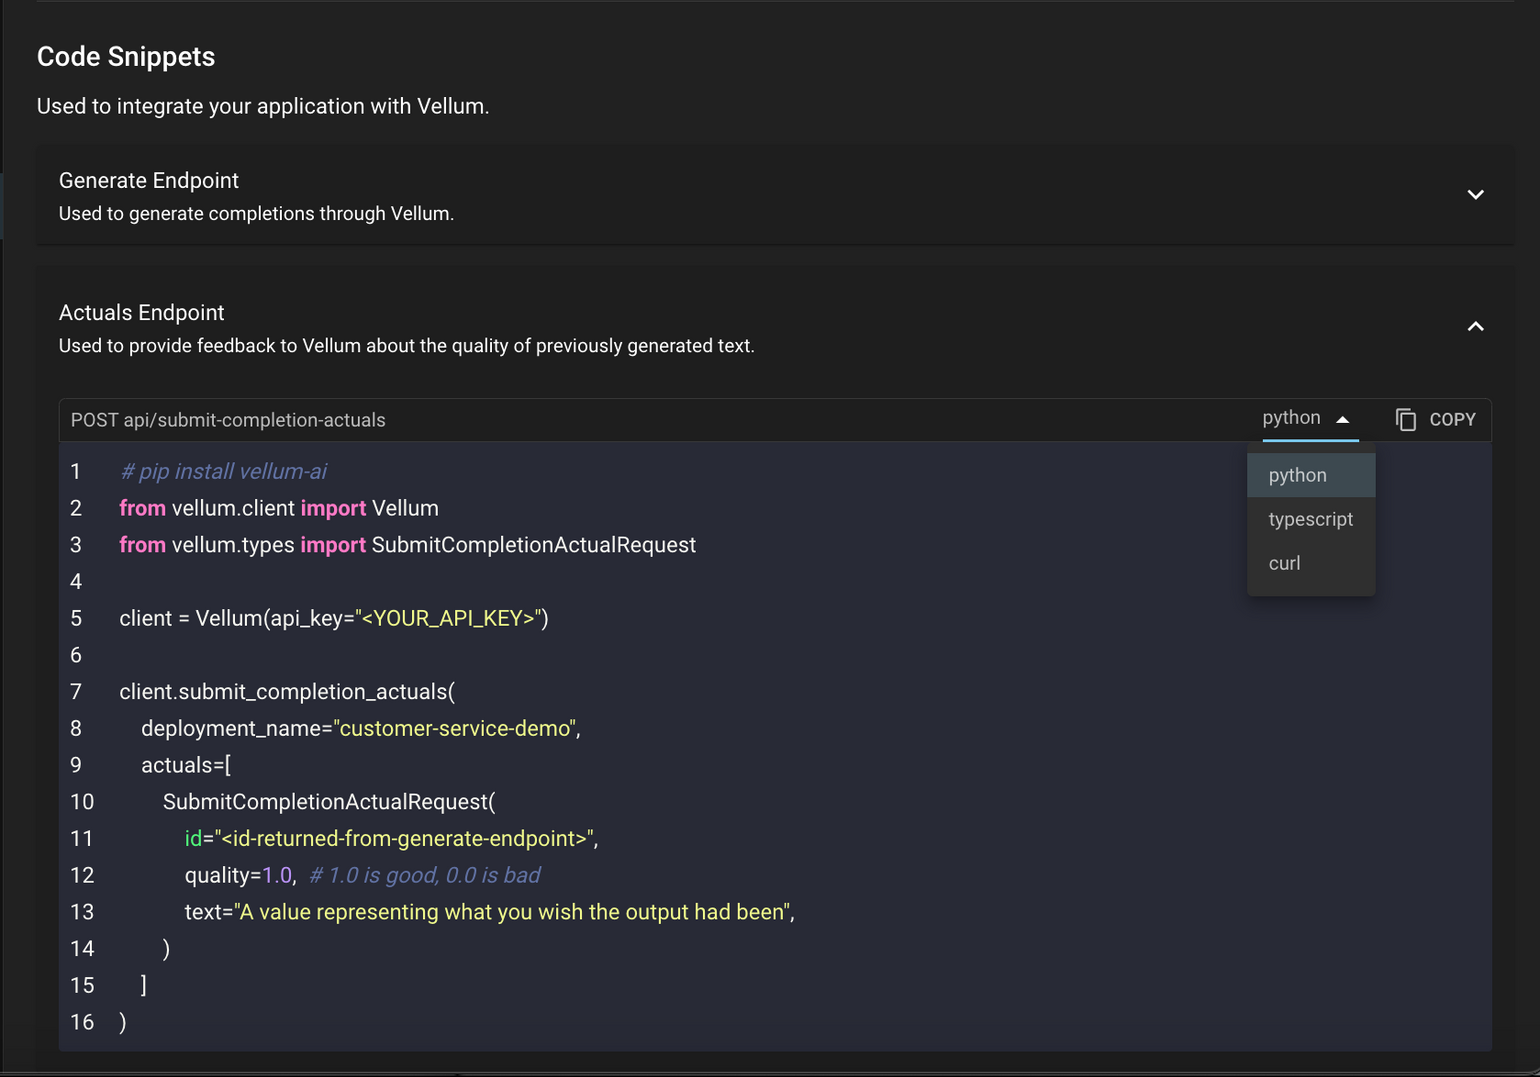
You can reference an Execution made previously by either:
- The ID that Vellum generates and returns in the API response
- A UUID that you track and provide via the “external_id” property
Online Evaluations
For continuous quality assessment of your deployed AI applications, Vellum offers Online Evaluations. This feature automatically applies configured metrics to every execution, allowing you to:
- Monitor performance in real-time
- Detect regressions as they happen
- Gather insights for improvements
- Compare performance across different releases
For more details on setting up and using Online Evaluations, see the dedicated Online Evaluations documentation.